What Do Those New Storm Attributes Mean?
by Daphne Thompson, on Feb 16, 2017 11:33:35 AM
If you have downloaded the most recent version of the RadarScope mobile app, you probably noticed new storm attributes are available. If you are wondering what they mean, you've come to the right place!
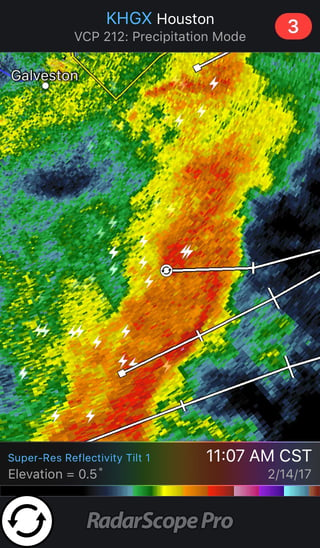
RadarScope 3.3 added storm attributes to the list of data that you can now display. When you turn on storm tracks, more than just a square with a line showing storm motion appears on your display. You now see three new symbols, depending on the strength of the storm.
 Hail
Hail
The Hail icon is identified as a circle within another circle. The algorithm to detect
Storms with strong updrafts are capable of having larger hail. The Vertically Integrated Liquid (VIL) product, which gives a liquid content value dependent on the distribution of raindrops and the reflectivity signal, can help determine hail size. When the VIL is divided by the height of the storm, VIL Density is the outcome. It is this number that leads to the estimated size of hail stones.
Damage from hailstorms can be devastating to crops, animals, roofs, automobiles and more. A thunderstorm will be classified severe when it produces hail larger than 1 inch in diameter. The largest diameter (7.9 inches) hailstone on record fell on July 23, 2010, in Vivian, South Dakota.
Mesocyclone (Meso)
The Meso icon is a circle with arrows moving in a counterclockwise (cyclonic) direction. When a large, rotating column of air is located within a thunderstorm, it is referred to as a mesocyclone. The diameter of this rotation can range from 2-6 miles, much larger than the size of any possible tornado that could develop from it.
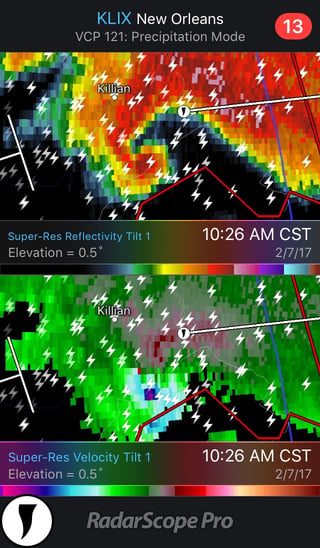
Many consider a storm to have a meso when they see it rotating, such as in a supercell. However, mesocylcone is a radar data term. For this symbol to be displayed, the data must meet a certain duration, magnitude, and vertical depth. While this image shows reflectivity, the best way to decipher why it is there is to look at multiple tilts of velocity data.
There have been many studies over the years on severe thunderstorms and mesocyclones. Ted Fujita, a pioneer of tornado research, was trying to understand how rotating storms could produce tornadoes back in the early 1970s. His study, Proposed Mechanism of Tornado Formation From Rotating Thunderstorm, has some wonderful illustrations that are still in use today.
Tornado Vortex Signature (TVS) 
The TVS icon is a circle with a tornado symbol. When rotation in a storm tightens up and becomes very concentrated in an area, you may see this icon. As is the case with a Meso, radar data must meet a certain duration, magnitude, and vertical depth. It is not unusual for a Tornado Warning to be issued for a storm when this occurs. However, it is important to note that the rotation you are seeing is not at ground level, so a tornado is not always linked to it.
The history of the TVS dates back to the 1970s. Don Burgess and his team at the National Severe Storms Laboratory (NSSL) detected an interesting velocity signature in relation to the Union City, OK tornado that struck on May 24, 1973. What they noticed was the Doppler radar showed high positive numbers nearly adjacent to high negative numbers. Many studies followed to verify the TVS
 Meso Strength
For storms displaying either a Meso or TVS, you will also notice a Meso Strength number which is also known as the Mesocyclone Strength Index (MSI).
When reading this number, note that an MSI of 0-2,300 is considered weak, 2,300-3,600 is moderate, and anything higher than 3,600 is strong. Seen in the associated image is an MSI of 7,059. A tornado did form from this storm and was rated EF-2.
The original idea for the algorithm to create Meso Strength can be found in an article published in 1998 by AMS. The authors; Mike Eilts, JT Johnson, DeWayne Mitchell, and Phillip Spencer from The National Severe Storms Laboratory Mesocyclone Detection Algorithm for the WSR-88D include those who eventually founded WDT as well as other who currently work here. While quite technical, it provides an interesting insight to how research is performed.
And remember, if you feel like your screen is a little cluttered with all this new data, you can always switch off the storm tracks or the mPING reports by tapping on your layers screen.


