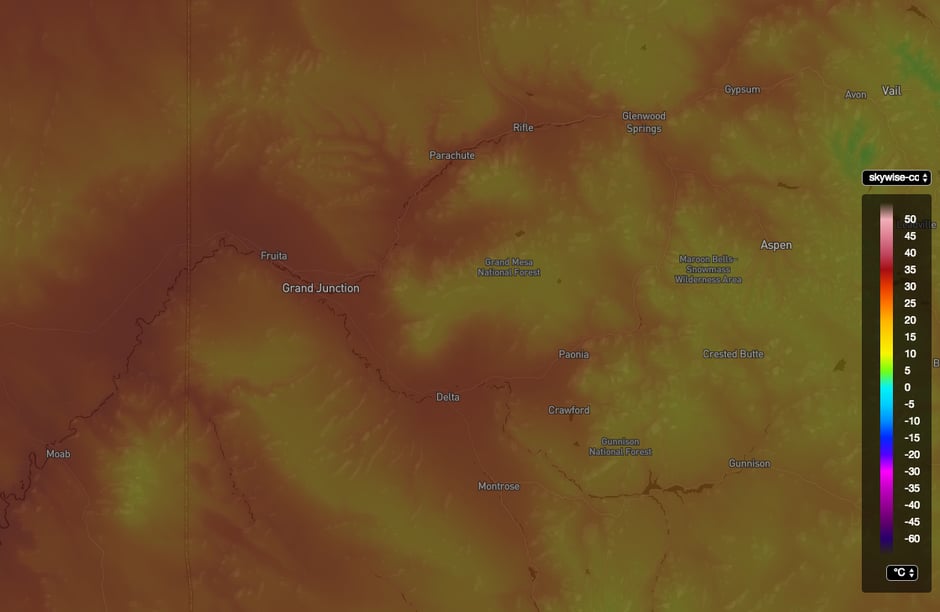
High-Resolution Weather Data with R
by Daphne Thompson, on Aug 4, 2017 10:52:32 AM
One of the pain points we run into at WDT is customers that need bulk weather data but have no experience with scientific data formats.
Since the release of our high-resolution analysis data (in NetCDF format), this issue has been coming up more frequently. Although we’ve offered CSV files in the past, there are a number of limitations with this approach.

The biggest issue is that CSV files will often be more than 20–30 times the size of the NetCDF. So, looking at a years worth of our hourly analysis data for 10 variables, the NetCDF distribution might weigh in at 750GB compared to 20TB for the equivalent CSV data.
Additional benefits of using NetCDF data is best described by its FAQ:
NetCDF data is:
Self-Describing. A netCDF file includes information about the data it contains.
Portable. A netCDF file can be accessed by computers with different ways of storing integers, characters, and floating-point numbers.
Scalable. A small subset of a large dataset may be accessed efficiently.
Appendable. Data may be appended to a properly structured netCDF file without copying the dataset or redefining its structure.
Sharable. One writer and multiple readers may simultaneously access the same netCDF file.
Archivable. Access to all earlier forms of netCDF data will be supported by current and future versions of the software.
While the benefits are clear, that still doesn’t make the format necessarily easy to work with. In order to fix some of these accessibility issues, I’ve written 2 more R packages. The first is a thin API wrapper that allows you to download the data in a convenient manner: SkyWiseDataTransferR
Usage is simple:
> Authorize('app_id', 'app_key')
> DataTransfer('skywise-conus-surface-analysis', directory = '.')
The second is a library for working with NetCDF files: SkyWiseNetCDFR
# extract the temperature grid
> grid <- ExtractGrid(fileName, "temperature")

# find the data value at a certain lat / lon
> val <- GetValueAtPoint(35, -97, grid)
# Extract a subset of the grid
> vals <- mapply(GetValueAtPoint, lats, lons, MoreArgs = list(grid))


