Enabling Time-Enabled GIS Data Services
by Matt Gaffner, on Aug 4, 2017 11:33:09 AM
All the best data services in the world are only as good as the application you have to display, interrogate, and analyze them. Throughout the history of GIS, most data that has been mapped has been relatively static. When data updated, you overwrote the shapefile and moved on. Maybe you’d have some point event data that had a date/time field, but you couldn’t animate through it. Furthermore, most of the data didn’t update on a frequent enough basis that you couldn’t just manually handle the update when necessary.

But that’s not the case anymore. Real-time has been a driving theme for ESRI over the past couple years, and it continues to be a focus for investment and new development as more and more rapidly updating and streaming data sets (IoT, etc.) emerge. However, to many in the GIS, world time-enabled map services are relatively new. In fact, the number one question I get when we provide demo access to our WeatherOps GIS weather data services hosted on ArcGIS Server is:
“I pulled the CONUS Radar Loop service into ArcGIS Online/ArcMap/Pro/Portal, but it doesn’t seem to work like all the other map services. Is the service down?”

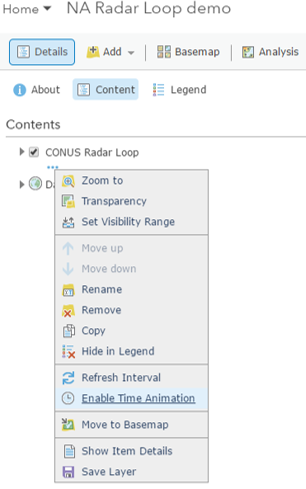
The scenario is always the same. The GIS professional inquiring about the data either didn’t realize the data was a time-enabled map service and/or they’d never worked with a time-enabled service directly. Reminding them to click the “Enable Time Animation” button does the trick…well, kind of.
AGOL/Pro/Portal/ArcMap all do a great job of displaying time-enabled map services, so long as the data on the back end of the service aren’t dynamically updating. If the data are dynamically updating on the back end, eventually all of the data will age off of the server and your time slider will stay tuned to the time period that loaded when the time-enabled map service was initially loaded. At this point, your map is continually looping through a data service for which there is no longer data.
Why is that a problem you ask?
Many organizations have control rooms where they display pertinent, real-time data on a monitor or series of monitors with their assets (buildings, trucks, transmission lines, pipelines). Those data need to stay up to date automatically. If you throw radar data, a time-enabled map service, on an ArcGIS Online map, you can pick your zoom and have the radar data animate through the last hour. However, the time slider won’t update, so you have to manually go in and refresh the map which defeats the purpose of real-time data on an ops wall.

To solve the problem, you have to write an application and/or a custom widget to keep the animated radar up to date, so we did! This makes it super easy to have a real-time radar application you can display on your ops wall and mashup with your data sets: buildings, trucks, transmission lines, pipelines, etc.
If you want to play with the app or the data service, let me know. Fill out this form: http://info.wdtinc.com/skywiseapis -> Under “How can we help?” type “GIS Services.”


